Every day you hear a new tale and song been sung amidst Coronavirus, so it gets difficult to really rely on any strategy that can become obsolete within no time.
So don’t jump blind, keep a binocular vision to analyse 20 top product categories and equate it to the same time frame in 2019 and earlier months in 2020. And hence you can come up with all important patterns being emerged.
From March 1st – 26th, 2020
Key Takeaways

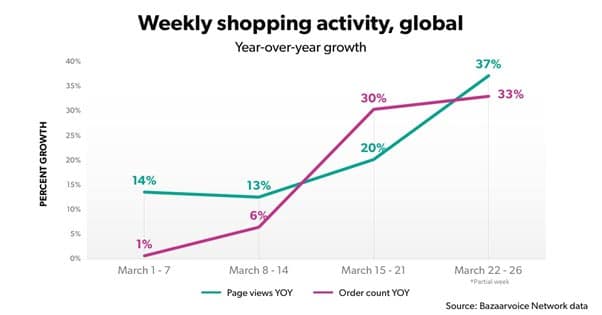
Industry saw page views and order counts rise by 20 percent and 16 percent respectively year-over-year. Looking at the order numbers by themselves for 2020, orders in March are up from February.
While the number of orders in 2020 saw a 2% YOY increase in January and a 6% increase in February, it leapt to a 16% increase in March as social distancing and shelter-in-place advisories began to be widely adopted.
Fact: In March the top ten days with the most orders on our network occurred in 2020. On March 11th, the order count started to increase, the same day COVID-19 was declared a global pandemic by the World Health Organisation.

- Food
- Beverage
- Tobacco
- Business and Industrial (which includes personal protective equipment)
- Office Supplies.
- Toys and Games and Sporting Goods
- Medication etc.
Consumers shopped reasonably for items they need to feel prepared to stay and work from home.
Crux
- Overall views of the website are up 20 per cent YOY.
- The number of orders is up 16 per cent YOY.
- In March 2020, the order count increased by 16 percent compared to 2 percent in January and 6 percent in February
Growth
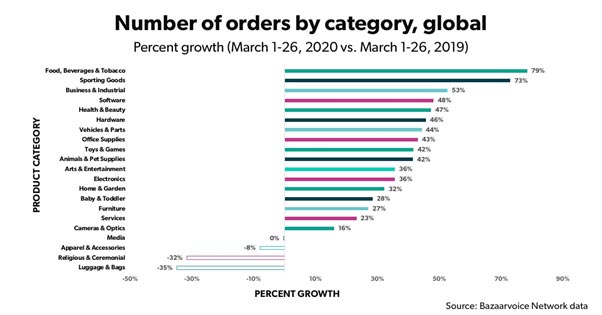
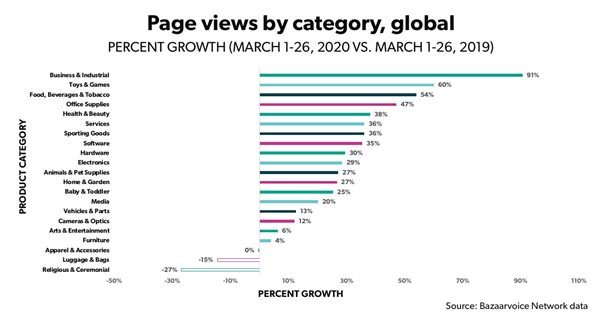
- In both page views (91 per cent) and order count (53 per cent), the business and industrial category (including work safety gear and medical products) was in the top five categories for production.
- Food, Alcohol, and Tobacco products were in high demand — the order count increased by 79 percent in the category and the review count increased by 89 percent.
- There has been a 73 per cent rise in order count for Sporting Goods goods — the third highest order boost group.
- The group of Toys and Games saw an rise of 60 per cent in page views and 42 per cent in orders.
- Office Supplies ranked in the top five categories for page views (47% growth) and had a growth in both order count (43%) and review submission count (89%) respectively.
Decline
- Religious and Ceremonial and Luggage and Bags were the only two groups to see both a decline in page views as well as a decrease in order count.
- Apparel and accessories saw no improvement in page views, but in order count they saw an 8 per cent drop.
Kinex Media have unparalleled exposure in e-commerce and retail network having a client base of top brands and retailer sites for years.
We know the dos and don’ts and prescribe the best ways to emerge better, brighter and stronger from this scenario.

We keep a sharp watch for:
- Shopping behaviour trends and changes
- Rises and decreases in views of the product page
- Orders placed
- Comments submitted, and so much more.
Give us a chance and enjoy the benefit of tried and tested expertise to grab maximum advantage for your Ecommerce.


